This article was originally published at Tenyks’ website. It is reprinted here with the permission of Tenyks.
In Part 2 of our NVIDIA TAO Toolkit series, we describe & address the common challenges of model deployment, in particular edge deployment. We explore practical solutions to these challenges, especially on the issues surrounding model comparison.
Here is a list of the topics we will discuss:
- Edge deployment: common challenges
- Highly varied and heterogeneous environments
- Highly varied and heterogeneous configurations
- Highly varied and heterogeneous data distributions
- Edge deployment: possible solutions
- Collecting intermediate outputs
- Viewing aggregated results
- A deeper dive with the Tenyks platform
Tune in to our Part #1 on NVIDIA TAO Toolkit Setup Tips and Tricks here.
Edge Deployment: Common Challenges
This section outlines the challenges faced during deployment of Deep Learning models on the edge. Using the NVIDIA TAO Toolkit v4.0 as our framework, we examine these challenges, which are also applicable to edge deployment in general.
Highly varied and heterogeneous environments
The initial challenge in edge deployment is the diverse and extensive range of environments a model must go through before reaching the “edge”.

The NVIDIA TAO Toolkit involves a series of stages a model should pass through before deployment on a hardware device, including: training, pruning, retraining, exporting, converting, and deploying. Phew!
Each step is crucial in making certain the model is optimized for a deployment that meets its desired goals: pruning can help to reduce the complexity of the model and improve its efficiency, while retraining can fine-tune the model for specific use cases.
Bringing attention to each step in the process helps to ensure that the final deployed model will be able to perform effectively and efficiently in its intended environment. For further details please refer to the TAO Toolkit Workflow here.
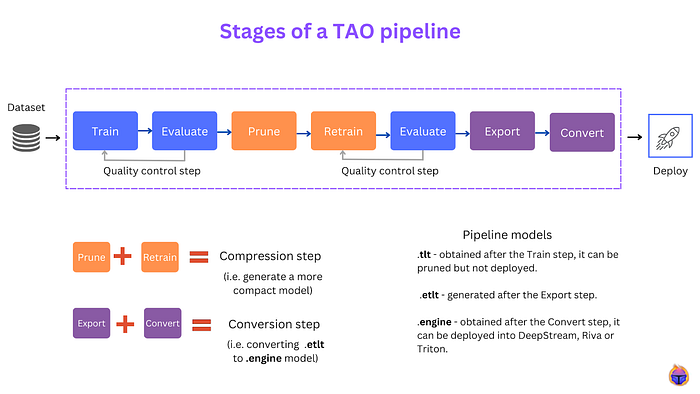
Figure 1. Before deployment, a model needs to go through a number of different stages in a TAO end-to-end pipeline
Crucially, these environments exhibit significant heterogeneity, ranging from an Azure Cloud GPU setup to a Linux-based Jetson environment. This variation extends to software packages, hardware limitations, software restrictions, and many other factors.
Highly varied and heterogeneous configurations
The configurations available at each stage of the environment often vary, which impacts the performance of the end model. Some of these factors include the degree of quantization, device-type, pre-processing, and scaling.
On top of that, it is important to consider the compatibility of these configurations with the intended use-case and desired outcome: a detector for counting people in a supermarket can aim for an accuracy of ~85%, while a people detector in a home security system should aim for 99%+.
The following figure shows the number of distinct possible models for an object detection pipeline based on YOLO v4-tiny using the NVIDIA TAO Toolkit:

Figure 2. Monitoring the different models that result from a MLOps pipeline is a very difficult challenge
In addition to the various configurations at each stage of the environment, the configurations within the pipeline can also vary greatly. Some of them deal with the architecture and training of the model, while others handle software packages or hardware. Importantly, these different types of configurations can impact the desired performance and functionality.
Understanding the dynamics between these configurations is key to determine the overall performance of the pipeline. For instance, the choice of hardware can affect the speed and efficiency of model training, while the selected software packages can impact the accessibility and compatibility of the model with other systems.
Side-note: Neural Architecture Search alone won’t help here, folks
Tip: If you would still like to know more about Neural Architecture Search (NAS), Elsken et al, 2019 have a great overview of the field.
Highly varied and heterogeneous data distributions
In practice, there are many “edges” to consider, such as deploying models to multiple building sites or buildings. As a result, each model ends working with distinct data distributions, making it increasingly challenging to keep track of these differences over time:
- Imagine you have developed a people detector, but it needs to function in both a bank and a construction site. While construction workers may wear hard hats, people in a bank are unlikely to be dressed in construction gear. Will your model be capable of accurately detecting people in both environments?

Keeping track of the data distributions and performance metrics for each model at each edge can help to identify any discrepancies or deviations from the expected results. How do you keep track of these performance metrics for multiple models in a systematic way?
Edge Deployment: Possible Solutions
In this section, we present some potential solutions to the problems outlined earlier, using the Tenyks platform as a demonstration. Additionally, we highlight similarities with commonly used CI/CD practices, because we all love CI/CD practices.
Collecting Intermediate Outputs
Early detection of problems is always more cost-effective than detecting them at the end of a long process. In a deployment pipeline, just as in CI/CD practices, we have multiple stages where model “code” is progressively tested before being moved to the next stage.
In this scenario, it is fundamental to implement an MLOps Infrastructure that enables the collection of intermediate outputs from the pipeline. This allows for continuous quality control of newly developed models.
In the software development world, testing the correct functioning of code is performed through various software tests (e.g. unit, integration). In the realm of machine learning and computer vision, we instead rely on performance changes of the model to gauge its quality & acceptability.
At Tenyks, we have created multiple converters that enable us to gather model inferences from various stages of a TAO pipeline and seamlessly import them into our platform through manual or automated processes.
This centralized approach provides us with comprehensive monitoring of the models during different stages of production, leading to improved visibility and the ability to detect and fix issues at an early stage, resulting in cost savings and increased efficiency.

Figure 3. Tenyks provides in-depth model observations for every stage of an end-to-end pipeline
Viewing Aggregated Results
Problem #2 (highly varied and heterogeneous configurations) implies a high probability of having a very large number of models: how do you choose the best one for deployment?
To tackle this issue, a natural solution is to aggregate results across multiple models and compare them across multiple metrics.
These metrics can include “performance” measures such as mAP, mAR, and AUROC, as well as “speed” metrics (e.g. time per inference) and “efficiency” metrics (e.g. the amount of computing power used).
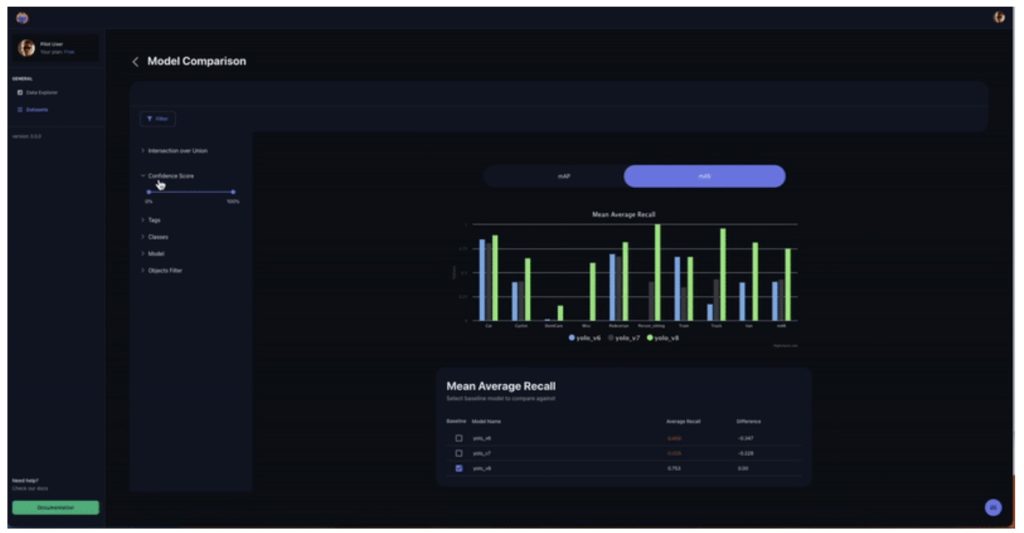
The Tenyks platform provides an intuitive dashboard for viewing multiple models across various metrics, such as mAP and mAR, enabling swift comparison.
However the above metrics are not enough: you want to be able to analyze performance on specific data slices, such as performance on a sensitive class. The following video shows how the Tenyks platform can help you analyze the undetected objects of the Pedestrian class in the Kitti dataset.:
Figure 4. Find undetected objects (i.e. FN) in the Tenyks platform
This ability to observe and compare models greatly streamlines the deployment process and enhances decision-making capabilities, ensuring that the best models are deployed and the right resources are utilized.
By providing this clear & systematic approach, Tenyks empowers teams to make informed choices and drive better results.
Figure 5. Model Comparison in the Tenyks platform
Taking a Deeper Dive
Finally, the ability to inspect individual models can prove relevant in ensuring their quality and accuracy. If an aggregate analysis highlights a misperforming model, it’s important to dive deeper into the reasons for its poor performance.
This can involve reviewing the evaluation data, and identifying specific points where the model made mistakes. Often, this analysis reveals shifts in data distributions.
For instance, in the Tenyks platform you can easily select a model and explore the underlying data to better understand potential errors and decreases in performance of your model.
Figure 6. Exploring a dataset and a model in the Tenyks platform
Future Outlook
In this blog post, we addressed the common challenges of edge deployment, including heterogeneous and complex environments, configurations, and data distributions.
To overcome these hurdles, we proposed solutions such as comprehensive model monitoring, aggregation of results for model comparison, and deeper exploration of model defects and errors.
We believe that the future of edge deployment lies in automation, just like in CI/CD. Intermediate quality control and comparison steps should be automated as much as possible to make the process more efficient, cost-effective, and precise.
At Tenyks, we are leading the way by incorporating automatic Data Quality Checks into our platform, which we will soon announce.
Authors: Jose Gabriel Islas Montero, Dmitry Kazhdan.