This blog post was originally published at Digica’s website. It is reprinted here with the permission of Digica.
Here goes a second edition of our special Christmas treat for you! (The first one was about Santa Classification using classical Computer Vision techniques. It not only was accurate – catching even the Grinch – but also provided feedback about exact pixels that stood behind the classification. And its third advantage is that it also showed me how bad I was at writing back then.)
This year we had to raise the stakes and show you a technology far less covered. What’s more, it has a far bigger business context than you might think.
You can’t detect Santa in the dark… or can you?
In our previous article we didn’t consider one thing. Santa detection will be quite challenging in a scarce amount of light. And that’s when Santa usually arrives… What technology to use then?
Actually it turns out that there is one technology that is both perfect for Santa classifying AND something that my company specialises in… it’s radars! Why?
- As I mentioned before, they help detect objects in the dark. It produces, transmits and receives back electromagnetic waves. No need for light here! But there’s more to that: even in the daylight typical computer vision analysis can be hard when there’s rain, snow, or direct sunlight. Radars are resistant to that (hence its popularity in automotive technology and in Santa classification).
- Santa will usually be far away. That’s when radars also come into play: they can spot objects that are even a few kilometres away! It means we can even spot Santa visiting your neighbour and omitting your house.
- Radar data helps keep a lot of information confidential. You don’t keep images of the suspected objects on your disk, just the spectra of it. It obviously increases Santa’s privacy. And if your kid finds your Santa classifier folder on the disk, they wouldn’t recognize immediately what you’re doing.
- Contrary to typical cameras, even the radar itself can be hidden from the human eye – it can be placed behind some opaque surface without any effect on the outputs. It means you don’t have to reveal to your neighbours what you’re up to!
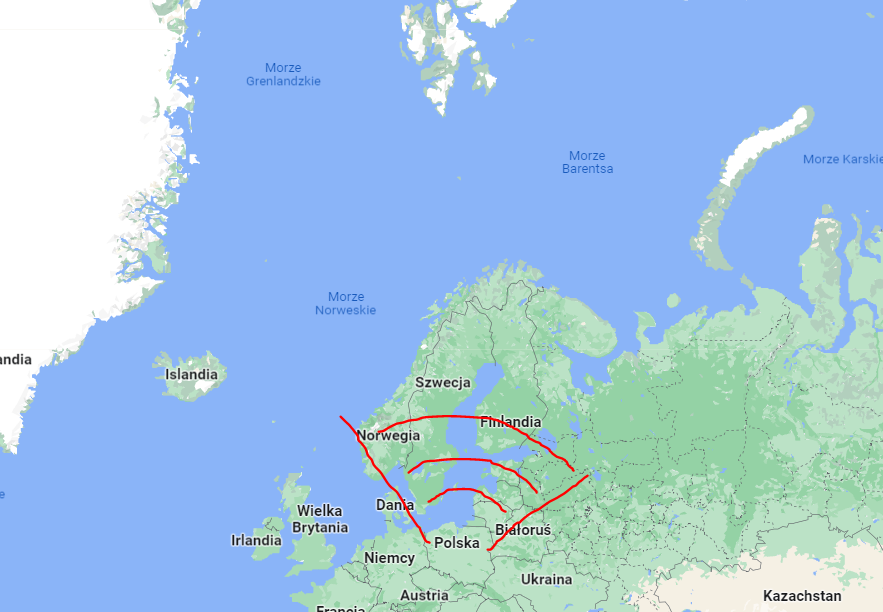
- Radars’ output provides azimuth of an object, which means we can get to know the direction of its movement. It’s an obvious advantage in our case. We should expect Santa to arrive from the North Pole… This is how our radar detector looks like from our Polish office perspective:
- Radars provide speed information as well. I’m not sure of the exact speed of Santa’s sleigh (do you?) but even some slight approximation can be handy to rule out planes and Superman.
- There is another interesting feature to be obtained from radars, which is called Radar cross-section (RCS). In short, it says how easy the object is to be observed. This is connected with the object’s size, obviously, but also the material it is made from (which influences, literally speaking, how much of the radio wave does this object reflect back to the sensor). What’s the takeaway for us? Let’s see the image below:
Source: https://discovery.ucl.ac.uk/id/eprint/10134022/1/open_radar%20(2).pdf
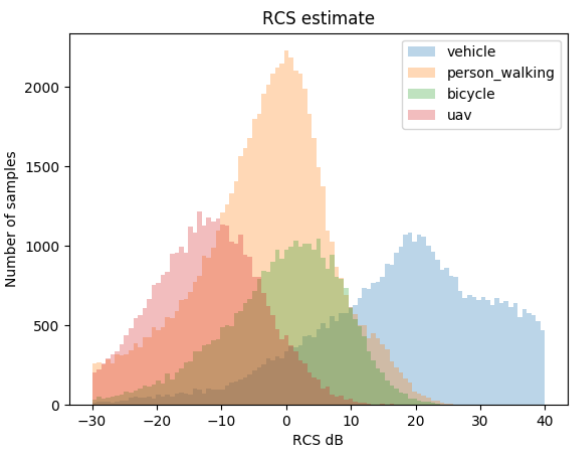
As you can see, using RCS feature is quite a hint when telling apart blue areas (vehicles) and red areas, like drones (represented by the “uav” category here – that is “unmanned aerial vehicles”). People and bicycles are a bit in the middle.
I don’t know about you, but for me Santa will probably fall into the blue category. Don’t be mistaken by the flying part of the “UAV” class – here we focus on how detectable an object is. In this case the size will actually be quite substantial when we take into account Santa and his sleigh… and the reindeer. Long story short, we’ll probably look for something the size of a vehicle. Just in the sky. Hence the blue distribution.
How about orange and green categories in the image? That’s where e.g. speed (the feature we mentioned earlier) can come to play. The actual spectra shapes will also help us then – but we’ll mention them in a bit.
As I said, radar data analysis is something we do at Digica quite often. I don’t want to shower you with the very details of it – it’s Christmas after all (besides, you can always contact us about it). However, there are a few technical hints and fun* facts that are not-so-obvious about the radar data.
*Please acknowledge though, that those facts are being “fun” for the author who is a Data Scientist
- Contrary to how typical visual data looks (e.g. has 3 colour channels), radars typically have just one (we can imagine it to be the data in just “black and white”).
- It is much harder to work with radar data instead of camera-based, typical RGB images, because typical images are more common. It means there are almost no models trained on radar data on the internet. However, It is possible to reuse models trained on…. RGB data. Just take some typical pretrained model (like ResNet) as a base and customise it for your radar data, as if you were applying typical transfer learning. Remember the stuff about radar data having just one channel, whereas RGB data expects 3? Just stack three identical channels of radar data on top of each other. It works smarter than it sounds.
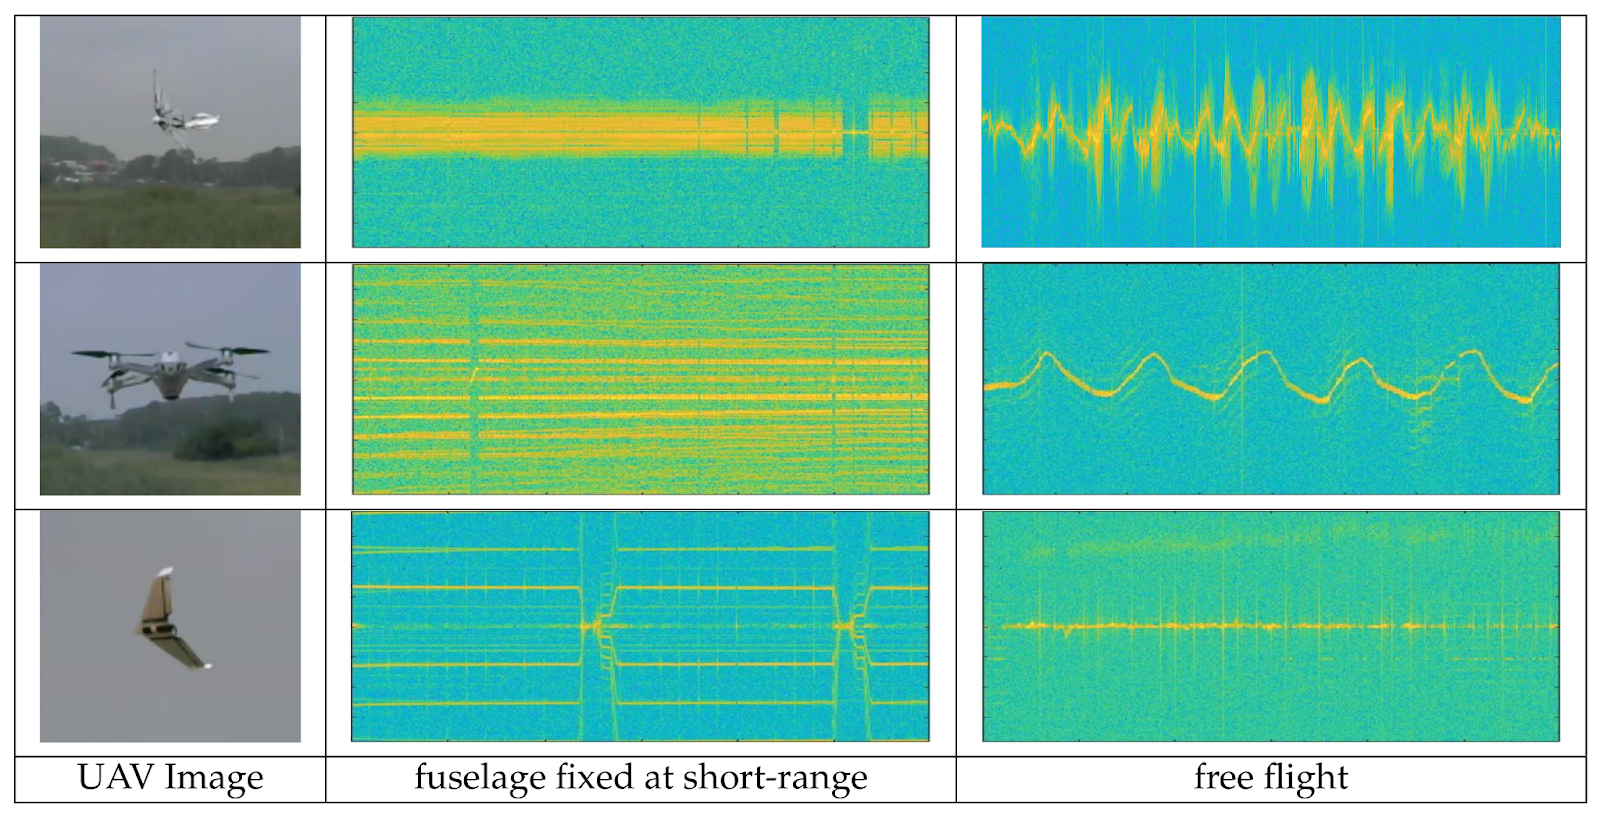
- The reason such things can work is that radar outputs look like images indeed. You can still find patterns there that could help you tell some objects apart, like on the spectra below:
Source: https://www.mdpi.com/1424-8220/21/1/210
For some weird reason I couldn’t find similar sources with Santa examples.
- Another atypical thing about radar data is that you cannot freely play with them in the augmentation phase, as you would do with typical images. Take for example top-bottom modifications:
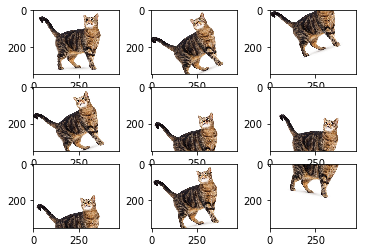
The parts where you get rid of the cat’s head are a big no-no (like, in general it’s inadvisable, but here for even more reasons). As the vertical axis often represents speed, in radar data such modifications might damage the data by modifying a very useful information. I mean – try it out if you’d like, but such data (cropped in the upper or bottom part of an image) will never occur in real life scenarios.
Shifts on the horizontal axis should make sense though. Moving the signal from left to right will usually mean just changing its emergence in time.
As you can see, radar data is useful but has to be handled well. By the way, some people also appreciate them for tasks like weather monitoring, military, geology, medicine or navigation – but let’s be honest: who cares about that if you can focus on spotting a Santa with reindeers instead?
PS. This article wouldn’t exist if it weren’t for my fantastic colleague and expert in radars in the same person, Joanna Piwko. Or it would be much dumpier and consist of 10 Santa memes.
Sylwana Kaźmierska
Data Scientist, Digica