This blog post was originally published at Tenyks’ website. It is reprinted here with the permission of Tenyks.
We break down and demystify common object detection metrics, including mean average precision (mAP) and mean average recall (mAR).
This is Part 1 of our Tenyks Series on Object Detection Metrics. This post provides insights into how to correctly compute and use mean average precision (mAP) and mean average recall (mAR) for object detection, while dispelling common misconceptions about AP, mAP, and third-party libraries such as TorchMetrics or pycocotools.
To illustrate the machine learning concepts discussed in this post, we will use an example of helmet detection. The goal is to detect two types of helmets commonly worn by workers on a job site, as shown in Figure 1.

Figure 1. Use-case: detecting classic and welding helmets
Ready to take your object detection results to the next level? Let’s get started!
The fundamentals
In Section 1, we get you up to speed with the building blocks to understand where mAP comes from. If you’re already familiar with object detection systems, feel free to skip ahead to Section 2.
Types of object detection predictions: True Positive, False Positive, and False Negative
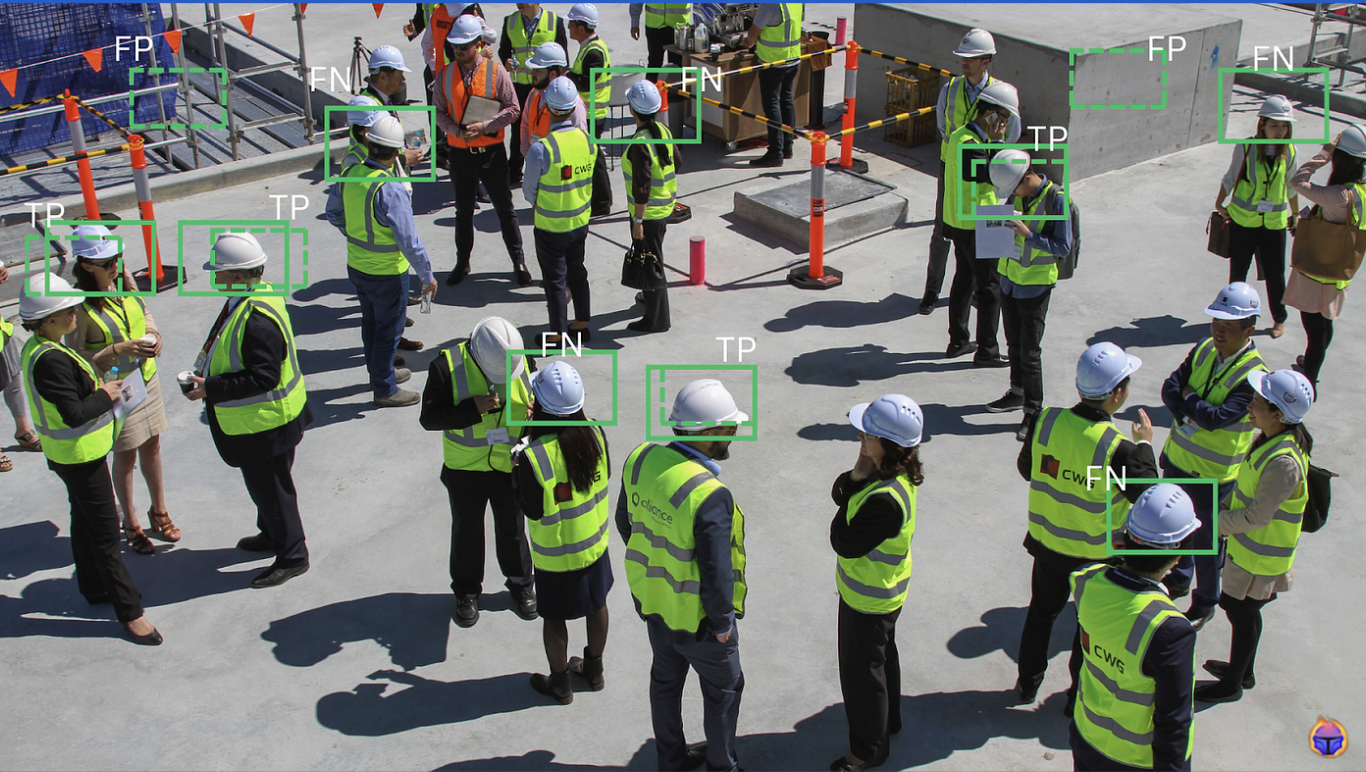
There are 3 types of predictions in object detection:
- True Positive (TP): correct model prediction. An annotation is matched with a prediction of the same class.
- False Positive (FP): incorrect model prediction. The model predicted a bounding box but no corresponding annotation existed.
- False Negative (FN): missing prediction. An annotation is not matched to any prediction (i.e. the object is present but was not detected by the model).
We show every case in the following diagram:

Figure 2. Types of predictions in an object detector
Precision and Recall
We use true positives (TP), false positives (FP), and false negatives (FN) to calculate the precision and the recall of our object detection model for a given class.
We define a positive prediction as one where the prediction is correctly matched with an annotation. To qualify as a positive prediction, we need to add two additional requirements: (i) the prediction must have a high enough confidence score, (ii) it must also have a high enough IoU with a ground truth bounding box of the same class to be considered a match (don’t worry, we describe how to compute the IoU in the next section).
Once clarified what a positive prediction is, Precision tells us the fraction of the positive predictions that are actually correct.
precision = true positives / (true positives + false positives)
Recall tells us the fraction of actual positive instances the model is able to correctly identify.
recall = true positives / (true positives + false negatives)
When to prioritize one over the other is evaluated on a use-case basis:
- In a spam email classifier, it might be preferable to have higher precision than a higher recall: falsely flagging a legitimate email as spam (a false positive) could have serious consequences for the user, while missing a few spam emails (false negatives) might not be as harmful.
- In a medical diagnosis application, we might favor recall over precision: it’s more important to correctly identify all instances of a particular condition (even if some of them are false positives) to ensure that patients receive the necessary treatment.
Intersection over Union (IoU)
The IoU quantity determines when two bounding boxes should be considered a ‘match’ and counted as a True Positive. More precisely, this quantity evaluates the overlap between two bounding boxes: the predicted bounding box and the ground truth bounding box.
The IoU score ranges from 0 (no overlap) to 1 (the bounding boxes completely overlap each other).

Figure 3. A visual representation of Intersection Over Union (IoU)
Key Takeaway: The larger the IoU score the more a prediction “resembles” its ground truth.
We could sit here and continue explaining IoU to you, but let’s face it, other blogs have explained it more times than we’ve had cups of coffee today, and that’s saying something. So we’ll spare you the boredom and move on.
IoU threshold
We define a threshold (i.e. the IoU threshold) used to determine whether a detected object in an image is a match to a ground truth object, and is considered a true positive.
This threshold is a tunable value depending on the use case. One of the most common approaches to compute mAP nowadays, based on the COCO dataset, considers a range of IoU thresholds between 0.5 and 0.9. However, other approaches to mAP such as Pascal VOC use a single IoU threshold value of 0.5. Overall lower thresholds consider more loose matches as true positives while higher thresholds enforce very strong matches.
Confidence threshold
In object detection, a confidence threshold determines the minimum confidence score required for a prediction to be considered “valid”. Predictions with a confidence score below the confidence threshold are ignored and excluded from subsequent calculations. If there is a ground truth bounding box corresponding to an ignored prediction, it counts as a false negative -a missed detection.
Setting a higher confidence threshold results in fewer but more reliable predictions, while a lower value threshold results in more prediction but with a higher likelihood of false positives:
- Lower confidence threshold => higher Recall, at the risk of more false positives
- Higher confidence threshold => higher Precision, at the risk of more false negatives
Basically, the confidence threshold is like a bouncer at a nightclub, but instead of keeping out the riff-raff, it keeps out the bad detections. If a detection doesn’t meet the confidence threshold, it doesn’t get in: sorry, not sorry, Mr. False Positive, but you are not on the list tonight.
Key Takeaway: For a prediction to be considered a true positive (i.e. correct detection), it must meet two criteria: 1) Have a confidence score above the confidence threshold, and 2) Have an IoU with a grounding truth bounding box of the same class above the IoU threshold. Note: in case when multiple predictions match to one ground truth, the one with the higher IoU score “wins”, i.e. an annotation can be matched with at most one prediction.
From average precision (AP) to mean average precision (mAP)
Having covered IoU and confidence thresholds, it’s time to tackle average precision (AP), and mean average precision (mAP).
In practice, different values of IoU and confidence thresholds produce different precision and recall scores. Unless you have a perfect detector (lucky you!), setting a lower confidence will sometimes result in more TPs, but may also result in more FPs. Hence, in order to understand how this trade-off looks like, we can plot Precision-Recall curves, showing the values of the Precision and Recall for different IoUs and Confidences.
The Precision-Recall curve is often presented in one of two ways: with a fixed IoU and a varying confidence threshold (i.e. PASCAL VOC challenge), or with a varying IoU and a fixed confidence threshold (i.e. COCO challenge).
Key Takeaway: How do I know if my detector is performing well? A detector performs well when it can achieve high recall while maintaining high precision. If increasing recall significantly reduces precision or requires a large increase in false positives, that might indicate poor performance.
As shown in Figure 4, we display the average precision (AP) for each of the three classes by computing the area under its Precision-Recall curve. For simplicity, we assume a single IoU=0.5 and vary the confidence threshold from 0.0 to 1.0. Figure 4 illustrates three cases: a perfect class with AP=1.0 (unlikely in practice), a good class with AP=0.8, and a poor class with AP=0.4 (in this case, reducing confidence significantly reduces precision).

Figure 4. Average precision (AP) for different classes
We can obtain the mean average precision (mAP) as the mean of the AP for all classes:
mAP = (AP of class A + AP of class B + AP of class C) / 3
mAP = (1.0 + 0.80 + 0.40) / 3
mAP = 0.73
Mean Average Recall (mAR)
Intuitively, average precision (AP) represents the “average precision value over all recall values”, which is represented by integrating precision over all recall values (aka the integral of the area under the curve), and is typically approximated numerically [1].
Consequently, we may be inclined to think that average recall (AR) would be the average recall value over all precision values, but it turns out this is not the case.
In existing literature, AR is defined as the recall averaged over a range of IoU thresholds (from 0.5 to 1.0), and can be approximated as shown in Figure 5–a, where o is the IoU, and recall(o) is the recall-IoU curve, with recall on the y axis, and varying IoUs on the x axis [2].

Figure 5. (a) Average recall and (b) Mean average recall
We can compute mean average recall (mAR) as the mean of AR across all classes as shown in Figure 5-b, where K is the number of different classes. This is perhaps less surprising, as it is consistent with how mAP is computed from AP.
In practice, there is no consistency in the way to compute mAR, with three most common approaches being:
- average recall over a number of IoU ranges [0.5, 1.0] (used in the COCO dataset & available in TorchMetrics).
- average recall over a set of confidence thresholds.
- average over both IoU and confidence thresholds.
mAR can be useful as a complement to mAP, however if recall is more important for your use case, mAR may be a better metric. Bear in mind that mAR does not account for false positives, hence it should be used alongside mAP for a full view of performance.
We summarize Section 1 in Figure 6, where the confusion of a term is represented in color. For instance, AP and AR are the two concepts with the highest confusion, meaning you can’t find a single consistent definition among different sources.

Figure 6. Summary of object detection metrics covered in this article. Color represents the amount of confusion there is about a given term
Common misconceptions around mAP
The previous section covered the fundamental definitions of IoU, average precision (AP), mean average recall (mAR), and mean average precision (mAP), among other concepts. In this section, we explore some variations and considerations for how these metrics are applied in practice, as well as some common misconceptions surrounding these topics.

Misconception #1: average precision (AP) and mean average precision (mAP) can be used interchangeably
Reality: AP is a per-class measure calculated as the area under the curve (AUC) of the Precision-Recall curve, while mAP is the average of the AP calculated for all the classes.

Where does the misconception come from? COCO’s project official documentation explicitly highlights no distinction between AP and mAP:
“We make no distinction between AP and mAP and assume the difference is clear from context.” Source
Key takeaway: AP and mAP are not meant to be used interchangeably, but in some cases (i.e. COCO dataset and tools) there is no distinction between the two.
Misconception #2: There is a standard way of computing mAP by third party libraries
Reality: There is no consensus with respect to a unified way of computing mAP by third party libraries, hence you need to verify that your team, your customers and other collaborators are using the same definition across your experiments.
To make it crystal clear, there are at least two ways to compute mAP:
- Pascal VOC: the mAP as presented in the Pascal VOC challenges was the standard approach, this definition uses a single IoU=0.5, and averages over multiple confidence thresholds.
- COCO challenge: a new variant (and the current dominant one) to compute mAP was introduced in this challenge. The mAP is averaged over 10 IoU thresholds (0.5, 0.55, …, 0.95) while using a single confidence threshold.
There might be some cases where users average over both thresholds: they average over multiple confidences, and also over multiple IoU thresholds, hence it’s crucial that your mAP definition is consistent across your experiments.
Key takeaway: Avoid inconsistent results in your detector performance by making sure your team is using the same mAP library so that you use the same mAP definition across your experiments.
In case you are curious, some of the most used libraries in Pytorch such as TorchMetrics and pycocotools compute mAP as follows:
AP and AR are averaged over multiple Intersection over Union (IoU) values. Specifically we use 10 IoU thresholds of .50:.05:.95.
Misconception #3: TP, FP, FN are enough for conducting model failure analysis
Reality: Misprediction metrics, such as Ghost Predictions, can provide additional and non-obvious information beyond the scope of the orthodox trio TP, FP & FN.

Figure 7. A granular inspection of certain edge cases provides deeper insights to understand False Positive (FP) and False Negative (FN) predictions
A good first step to answer these kinds of questions, and to go beyond aggregating metrics such as mAP or mAR, is to use a tool we call the Multiclass Confusion Matrix for Object Detection (MCM).
In our next post we introduce what the MCM is, and how it can help you get a deeper understanding of what types of errors our model makes.
Summary
In this blog post, we revisited the building blocks of how to compute mean average precision (mAP) and mean average recall (mAR) from the ground up. We also highlighted some misconceptions of mAP that often affect both newcomers and seasoned practitioners alike.
Key takeaways:
- The larger the IoU score the more a prediction resembles its ground truth.
- For a prediction to be considered a true positive (i.e. correct detection), it must meet two criteria: 1) Have a confidence score above the confidence threshold, and 2) Have an IoU with a grounding truth bounding box of the same class above the IoU threshold.
- A detector performs well when it can achieve high recall while maintaining high precision. If increasing recall significantly reduces precision or incurs a large increase in false positives, that might indicate poor performance.
- AP and mAP are not meant to be used interchangeably, but in some cases (i.e. COCO dataset and tools) there is no distinction between the two.
- Avoid inconsistent results by making sure your team is using the same definition for mAP.
Don’t miss out on other great posts, including NVIDIA TAO Toolkit Common Pitfalls. Unlock the full potential of the NVIDIA TAO Toolkit with our series on these topics!
References
[1] End-to-End training of object class detectors for mean average precision
[2] What makes for effective detection proposals?
Note: All images for this post are from unsplash.com, based on the unsplash license.
Authors: Jose Gabriel Islas Montero, Dmitry Kazhdan.
If you are interested in having early access to Tenyks, let us know: [email protected].